Within-host dynamics and disease outcomes
This can be seen as an extension of the “step-by-step” framework of infection. We took advantage of the tools offered by D. melanogaster to study in detail the step where pathogens proliferate within their host. We studied the impact of variations during this step on the outcome of infection Duneau et al. 2017.
Within a population of sick hosts, individuals are not equal when facing disease. This variation, which sometimes determines the survival or death of hosts, is present even when controlling for the host’s genetics and environment. We studied the role of the proliferation step in mortality variation. By monitoring bacterial populations over time within hosts of the same population and using modelling tools (“mixture models”), we were able to describe the phases of proliferation and propose measures to characterize them.
- Time to control the infection (Tc)
- Pathogen Load Upon Death (PLUD)
- Set-Point Pathogen Load (SPPL)
By modifying the immune characteristics of the host, in collaboration with Nicolas Buchon, we were able to determine the relative roles of the host and the parasite in this phase. We established that the variation in the probability of survival depends on a key parameter of the infectious process: the time that hosts take to control bacterial proliferation. A difference of a few hours in this control time can make the difference between survival and death.
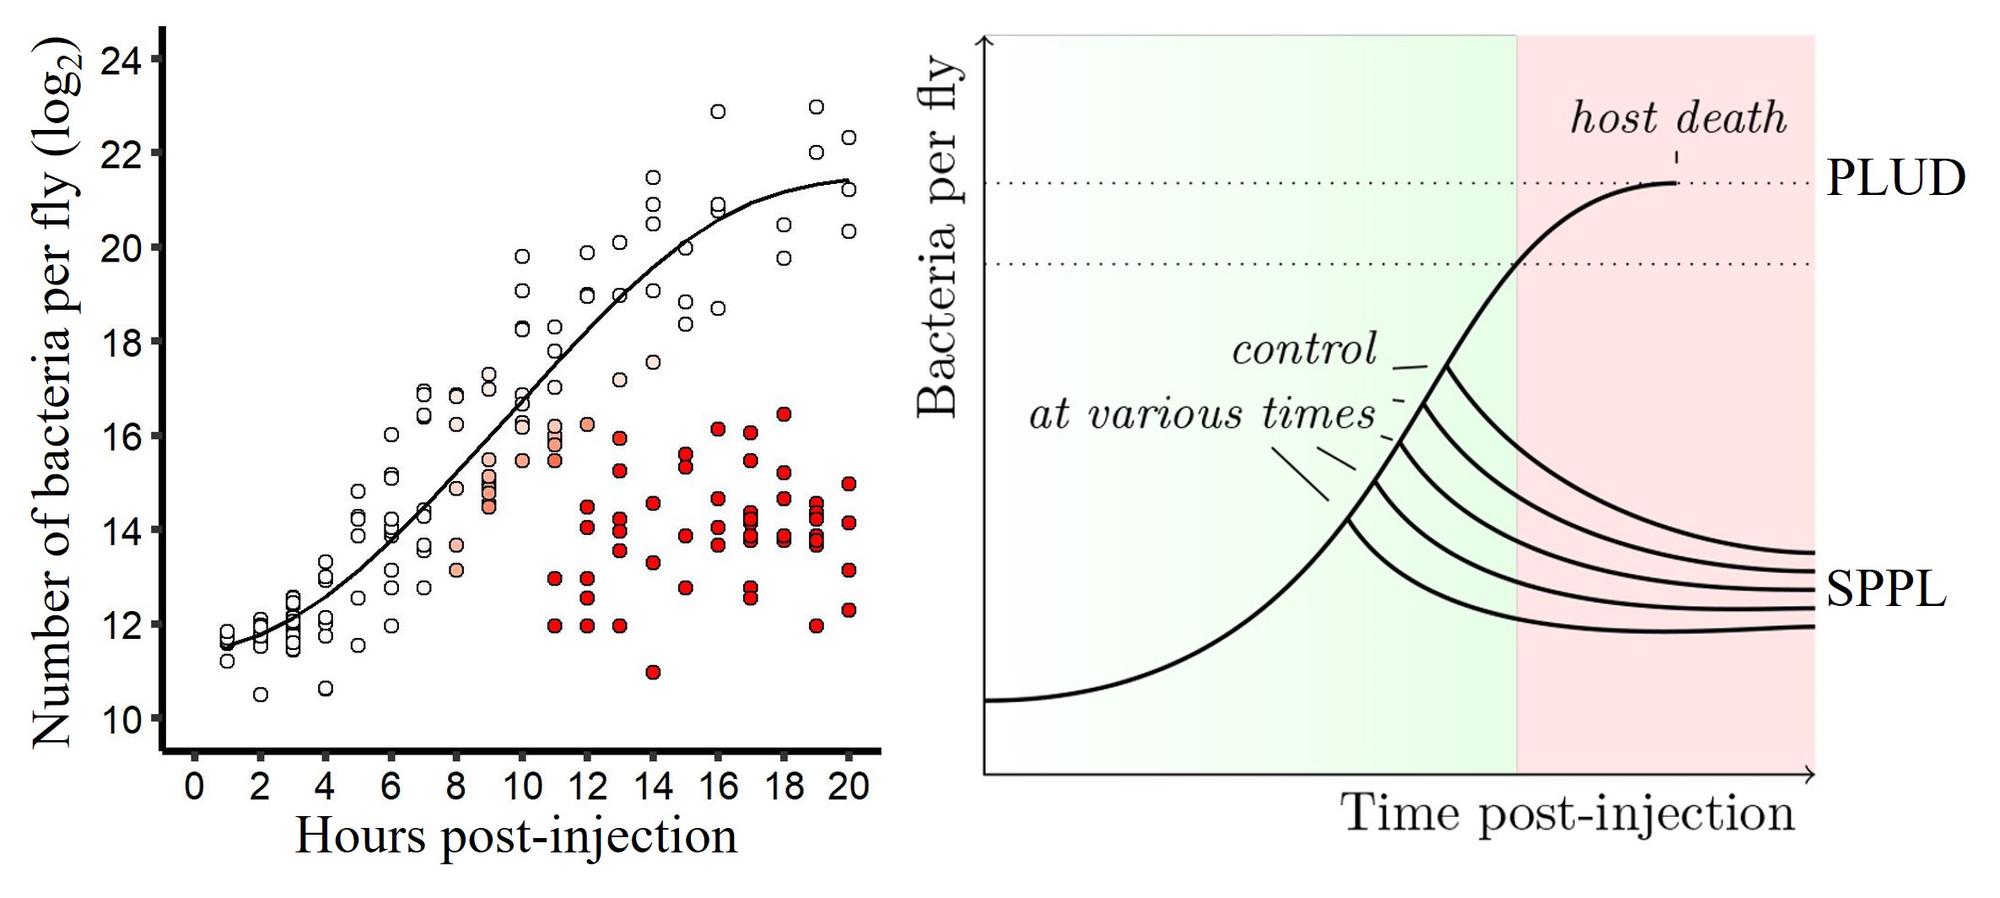
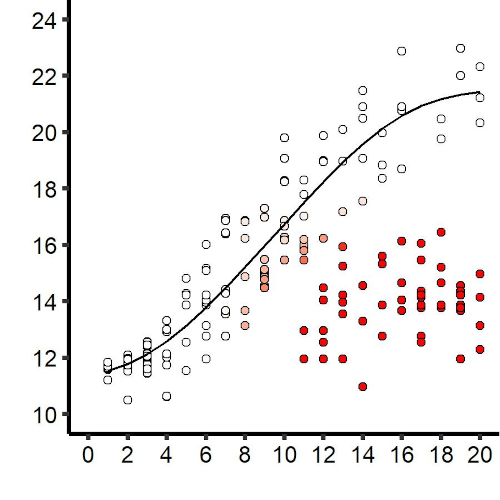
In the figure above, the graph on the left shows bacterial proliferation within Drosophila using a population method. Eight genetically identical hosts are sacrificed every hour to establish the distribution of bacterial load within the population of infected individuals at a given time. In red, the hosts that are likely to have controlled the proliferation. The scheme on the right describes the model of infection dynamics. The bacterial population initially proliferates without host control (the black line corresponds to exponential growth, matching growth in vitro). Then, the immune system becomes effective enough to control proliferation. The time to control (Tc) varies between hosts due to variation in the speed of activation of the immune system.
If the exponential growth of the bacterial population is controlled before reaching a threshold called the “tipping point,” the host will maintain the bacterial population at a density called the Set-Point Pathogen Load (SPPL), and the disease becomes chronic. If control occurs after the tipping point is reached, the infection cannot be contained: it enters the terminal phase, and the host will die when the bacterial population reaches the Pathogen Load Upon Death (PLUD). Thus, the step of proliferation within the host is characterized by three phases: initial, resolution, and terminal (or chronic).
The tipping point is described here as a simple function of the load, but it is most probably not that simple and may also depend on the time spent at a given load. In other words, a host may reach the tipping point not because of the bacterial density per se, but because it can no longer tolerate the damage caused by a bacterial population, even a stable one, over a prolonged period.
We reviewed the potential of insect models for studying within-host dynamics and the emerging parameters that characterize disease outcomes Duneau & Ferdy, 2022.
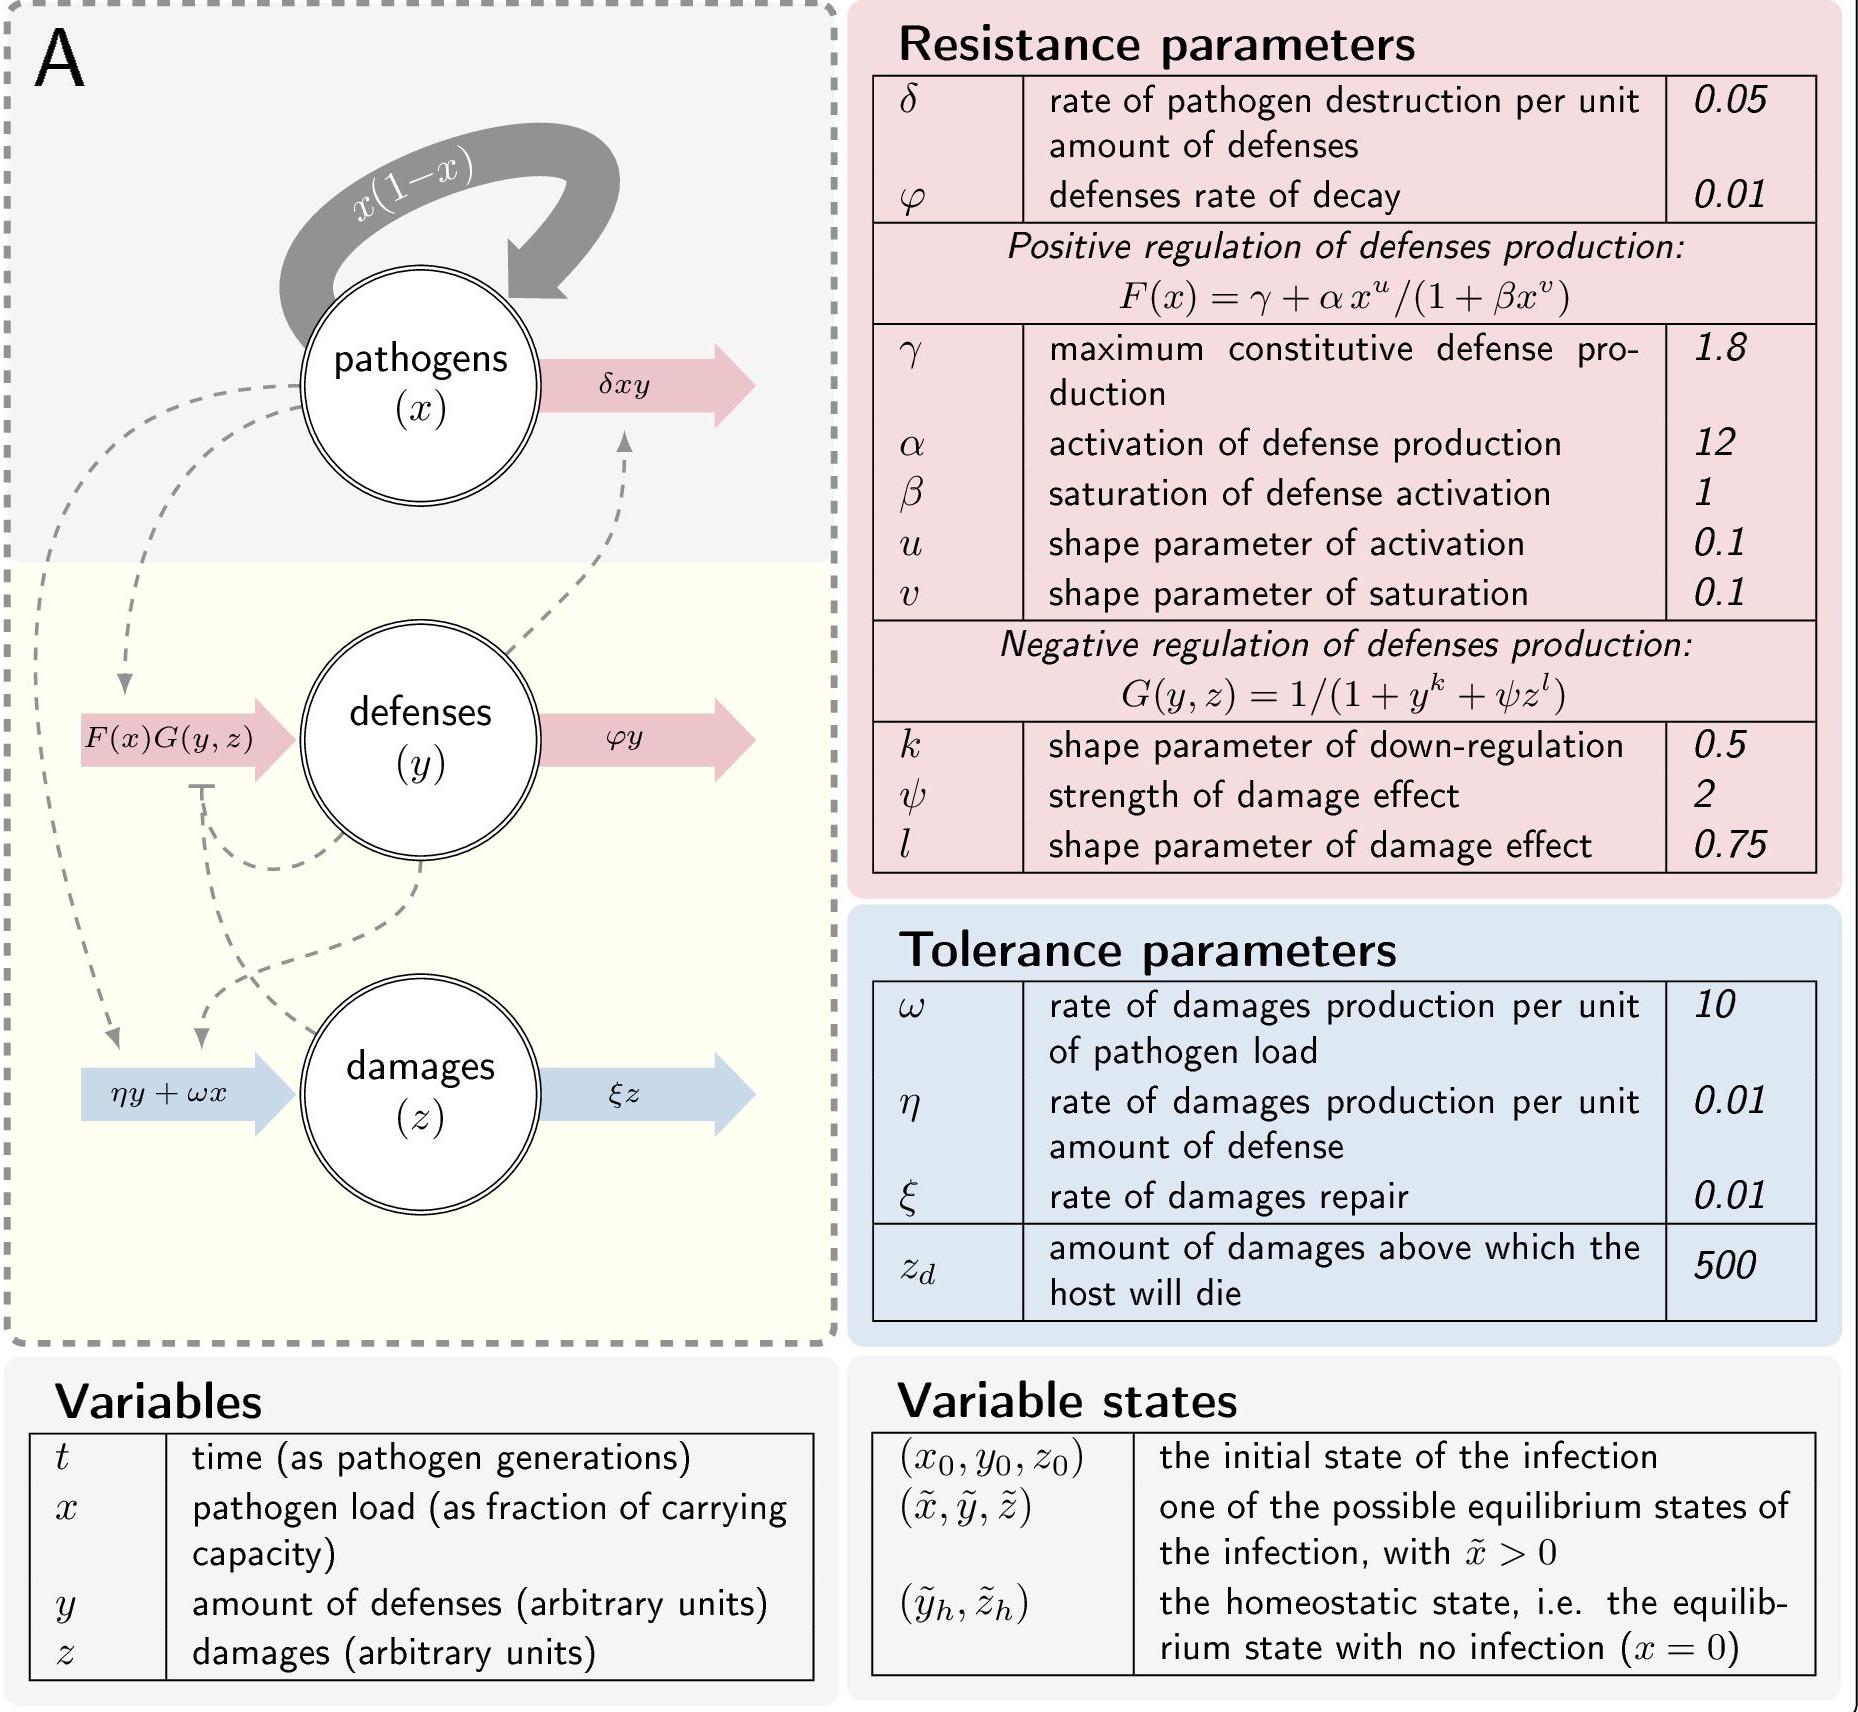
In collaboration with Jean-Baptiste Ferdy, we used theoretical models and experimental approaches to define more specifically the parameters of infection and determine their role in the two strategies to survive an infection (i.e. controlling the infection — resistance — versus tolerating the damage linked to the infection — disease tolerance) Duneau et al. eLife 2025. This work aims to describe precisely the dynamics of bacteria interacting with their hosts, to characterize the relevant parameters, and to compare dynamics statistically.
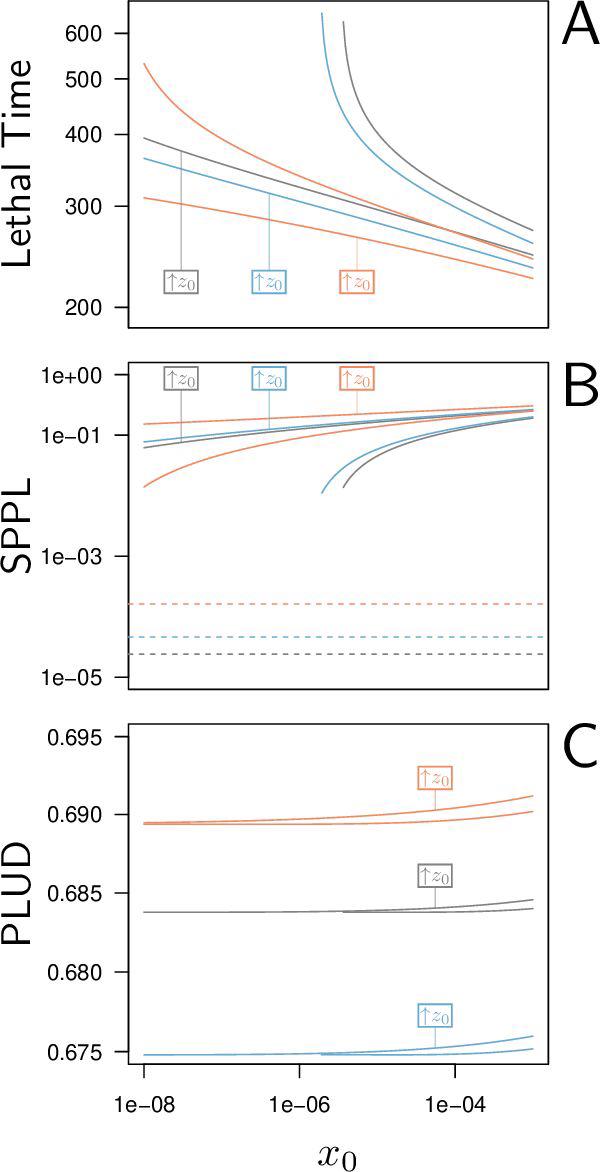
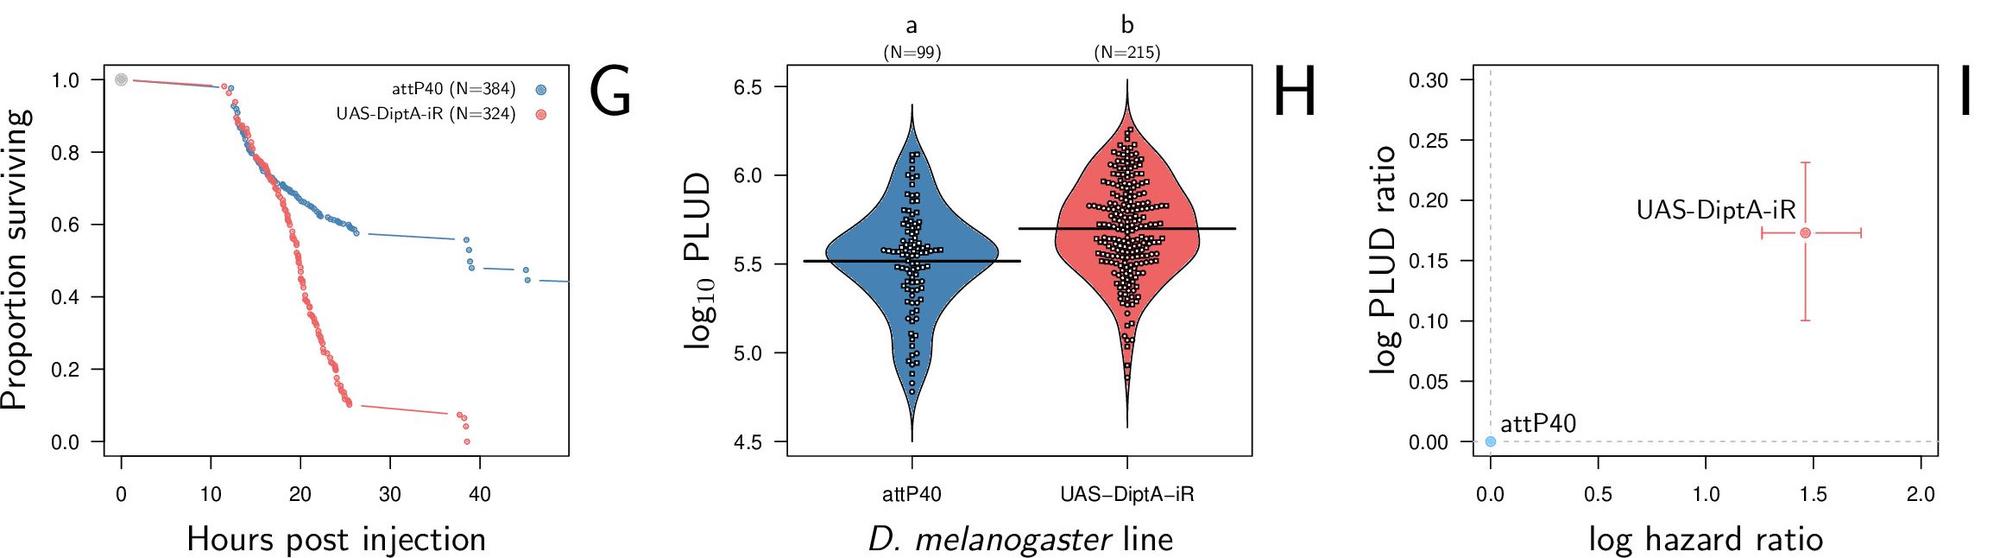
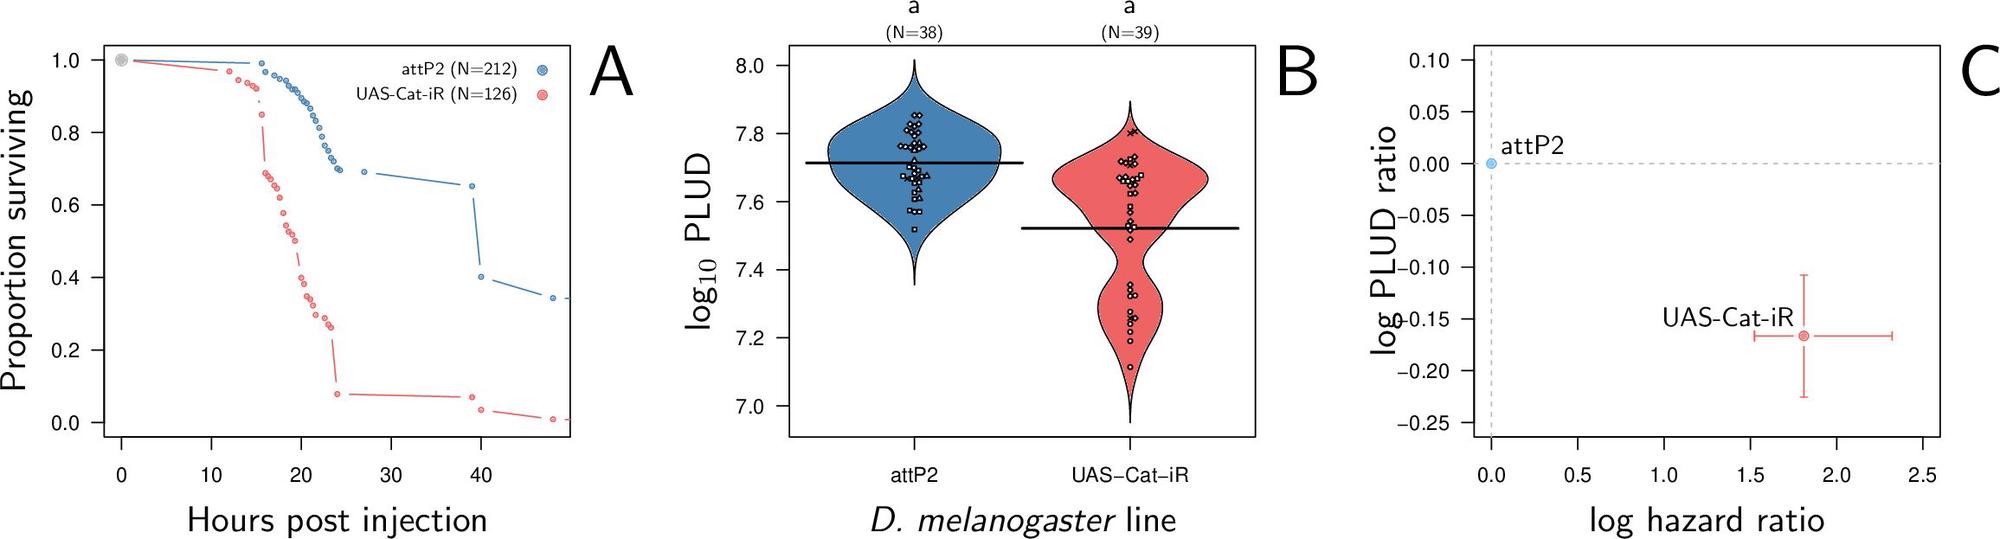
Our model predicts that PLUD should respond differently to changes in resistance and tolerance. This is because, during infection, pathogen load grows much faster than damage accumulates. When resistance is reduced, bacteria proliferate more freely and reach higher loads, but damage, which accumulates more slowly, has not yet reached the lethal threshold. By the time the host eventually dies, the bacterial load has climbed higher than it would have in a more resistant host: the PLUD increases. Conversely, when tolerance is reduced, the host reaches the lethal damage threshold sooner, at a point when bacteria have not yet grown as far: the PLUD decreases. Combined with a mortality measurement such as the Hazard Ratio (HR), the direction of change in PLUD can therefore help identify whether the source of susceptibility is a defect in resistance or in tolerance.
It had been proposed, based on verbal models, that comparing host survival across different doses could serve as a proxy for tolerance. Using our theoretical model, we did not find the same result. Instead, we found conditions where a change in resistance alters the slope of the relationship between lethal time and dose, while a change in tolerance merely shifts it. In these conditions, comparing survival across doses would be more representative of differences in resistance than in tolerance. Until the conditions under which this approach does capture differences in tolerance are clearly identified, caution is warranted when using it as a tolerance proxy.
We validated the PLUD prediction experimentally using Drosophila melanogaster infected with Providencia rettgeri. First, we reduced resistance by deleting or silencing key antimicrobial peptides (Diptericin A). As expected, these flies died faster (higher HR) and at a higher PLUD, consistent with a resistance defect. Second, we silenced Catalase, an enzyme that protects cells from oxidative damage caused by reactive oxygen species. These flies also died faster (higher HR), but this time at a lower PLUD, consistent with a tolerance defect. The contrast between these two results (higher PLUD when resistance is impaired, lower PLUD when tolerance is impaired) demonstrates that combining PLUD and HR measurements can experimentally distinguish the two sources of susceptibility to infection.
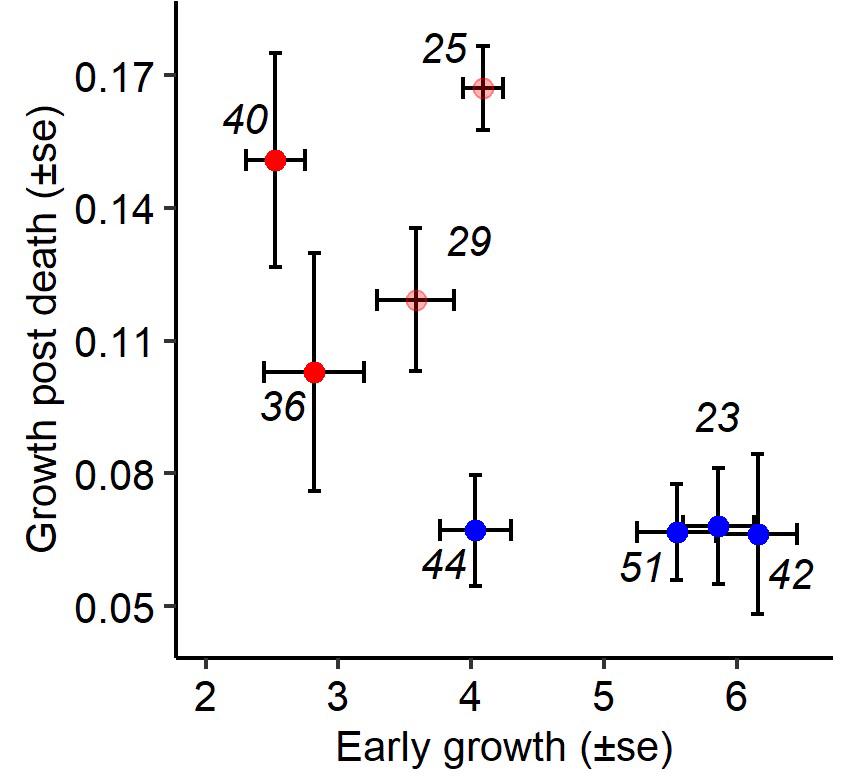
A continuation of this work allowed us to show that our approach could also be used to characterize the impact of mutations in bacterial pathogens on infection outcomes Faucher et al., 2021. The bacterium Xenorhabdus nematophila is in symbiosis with a nematode (Steinernema carpocapsae) to kill insect hosts. The bacterium, carried by the nematode, kills the host and waits until the nematode has reproduced in the host’s corpse to reassociate with its vector. During the course of an infection, selection alternately favours two morphs: one that allows the success of the infection, and one that is advantaged in the corpse. The mutation responsible for this second morph has been identified in the Lrp gene, a mutation that generally gives an advantage in the stationary phase of growth (known as a GASP mutation). Our study uses Drosophila’s genetic tools and the statistical method we developed to characterize the impact of different types of Lrp mutations on infections and to understand the characteristics that selected them. We show that GASP mutants are all less virulent, but that only missense mutations make bacteria more sensitive to the immune system during proliferation at the beginning of infection. The number of bacteria at the time of death (PLUD) is not affected, suggesting that the toxicity of the bacteria is not altered by the mutation, and that only differences in the ability to grow in the host are responsible for differences in virulence. We also show that the better post-mortem growth of mutants correlates negatively with their virulence, suggesting a trade-off between these two traits.
This study introduces a new approach to studying the effects of bacterial mutations in infection, an approach that will be crucial in my future research to characterize experimentally bacterial pathogens.
In a collaboration with Jennifer Regan’s lab at the University of Edinburgh, we applied the PLUD and HR framework to a long-standing question in the biology of ageing: why does susceptibility to infection increase with age? It is widely assumed that the answer lies in immunosenescence — the decline of the immune system’s ability to control pathogens. However, susceptibility also depends on the host’s capacity to tolerate the damage caused by infections, and many non-immune physiological functions that support tolerance also decline with age. By infecting both sexes of 22 Drosophila genotypes with Providencia rettgeri at young and old ages and measuring PLUD alongside mortality, we were able to determine whether the increased susceptibility of aged individuals was driven by reduced resistance or reduced tolerance. Strikingly, while some genotypes showed a classic immunosenescence pattern (higher PLUD, consistent with reduced resistance), a larger number showed a lower PLUD at old age, indicating that the increased susceptibility was often driven by a decline in tolerance. This result was genotype- and sex-dependent, but the direction of change was generally consistent between males and females of a given genotype. These findings establish that increased susceptibility to infection with age is not solely, and probably often not primarily, due to immune decline, and that the dysregulation of non-immune functions contributing to disease tolerance deserves much greater attention Monteiro-Black, Corbally et al. 2025.